| Previous | Next | Contents | Index |
This section shows examples of the web-based QM utility's web page displays on a sample system. Figure 33-12 shows the initial page displayed at
http://hostname:7633/qm/ |
root or pmdf on UNIX, or as
Administrator on NT).
Figure 33-12 Web-based QM Home Page
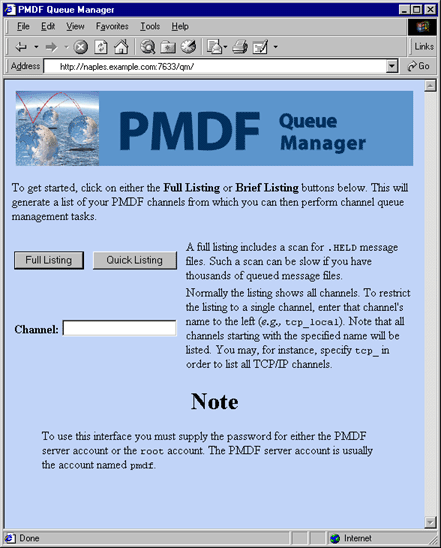
Figure 33-13 shows a sample of a quick listing, as displayed by selecting the "Quick Listing" button from Figure 33-12.
Figure 33-13 Web-based QM Quick Listing Page
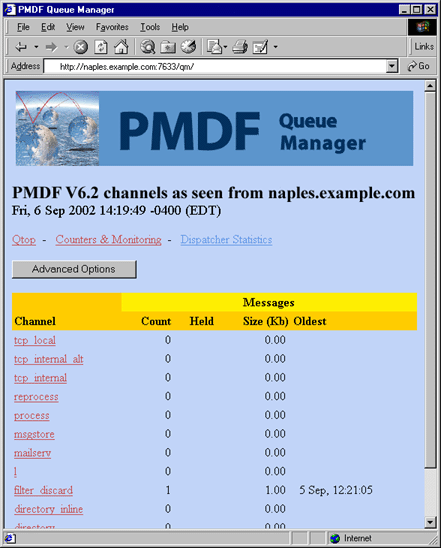
Figure 33-14 shows a sample of an advanced options page, as displayed by selecting the "Advanced Options" button from Figure 33-13. Scrolling further down such a page past the point visible in this figure, you would be presented with buttons for each channel for displaying the messages queued for that channel, for submitting a processing job for that channel, or for stopping that channel from running any new processing jobs.
Figure 33-14 Web-based QM Advanced Options Page
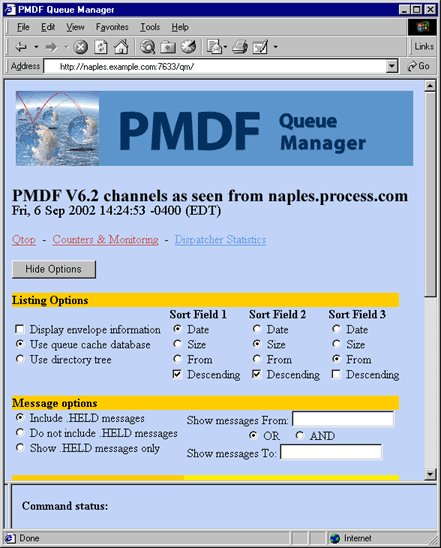
Figure 33-15 shows a sample of the filter_discard
channel display page, as displayed by clicking on the filter_discard
channel from the quick listing page, Figure 33-13, or by selecting
the List button from the advanced options page.
Figure 33-15 Web-based QM l Channel Page
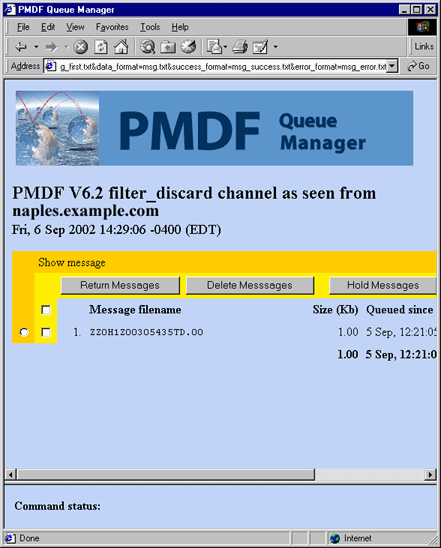
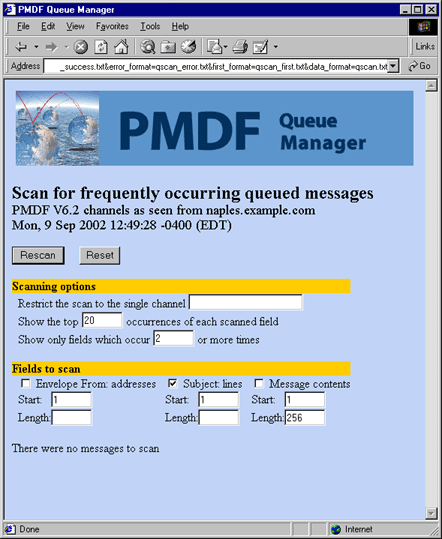
Figure 33-16 shows a sample of the Qtop page, as displayed by clicking on "Qtop" from Figure 33-13 or Figure 33-14. Qtop may be used to see what strings or addresses are frequently appearing in messages currently in the PMDF queue area. This can be particularly useful for spotting flurries of unsolicited bulk e-mail (spam) or chain letters. Figure 33-16 shows an example where there are numerous messages in the PMDF queue area whose Subject: header field is "Relay test".
Figure 33-16 Web-based QM Qtop Page

The web-based QM utility also has links on the listing and advanced options pages to the Dispatcher statistics display, such as the sample display shown in Figure 11-5.
| Previous | Next | Contents | Index |